Top 8 Rust time-series Projects
-
-
greptimedb
An open-source, cloud-native, distributed time-series database with PromQL/SQL/Python supported. Available on GreptimeCloud.
-
InfluxDB
Power Real-Time Data Analytics at Scale. Get real-time insights from all types of time series data with InfluxDB. Ingest, query, and analyze billions of data points in real-time with unbounded cardinality.

-
cnosdb
A cloud-native open source distributed time series database with high performance, high compression ratio and high availability. http://www.cnosdb.cloud
-
spiceai
A unified SQL query interface and portable runtime to locally materialize, accelerate, and query datasets from any database, data warehouse, or data lake.
-
-
-
SaaSHub
SaaSHub - Software Alternatives and Reviews. SaaSHub helps you find the best software and product alternatives


Scalable Realtime Datastore: The piece examines a scalable datastore specifically created for metrics events and real-time analytics. (2013-09-26, shares: 26787.0)

Project mention: Error Handling for Large Rust Projects - A Deep Dive into GreptimeDB's Practices | dev.to | 2024-05-12**A good error report is not only about how it gets constructed, but what is more important, to tell what human can understand from its cause and trace. We call it Stacked Error.** It should be intuitive and you must have seen a similar format elsewhere like backtrace. From this log, it's easy to know the entire thing with full context, from the user-facing behavior to the root cause. Plus the exact line and column number of where each error is propagated. You will know that this error is *"from the query "blabla", the fifth package's header is corrupted"*. It's likely to be invalid user input and we may not need to handle it from the server side. This example shows the critical information that an error should contain: - **The root cause** that tells what is happening. - **The full context stack** that can be used in debugging or figuring out where the error occurs. - **What happens from the user's perspective.** Decide whether we need to expose the error to users. The first root cause is often clear in many cases, like the DecodeMessage example above, as long as the library or function we used implements their error type correctly. But only having the root cause can be not enough. Here is another [evidence](https://github.com/delta-incubator/delta-kernel-rs/pull/151) from Delta Lake developed by Databricks: 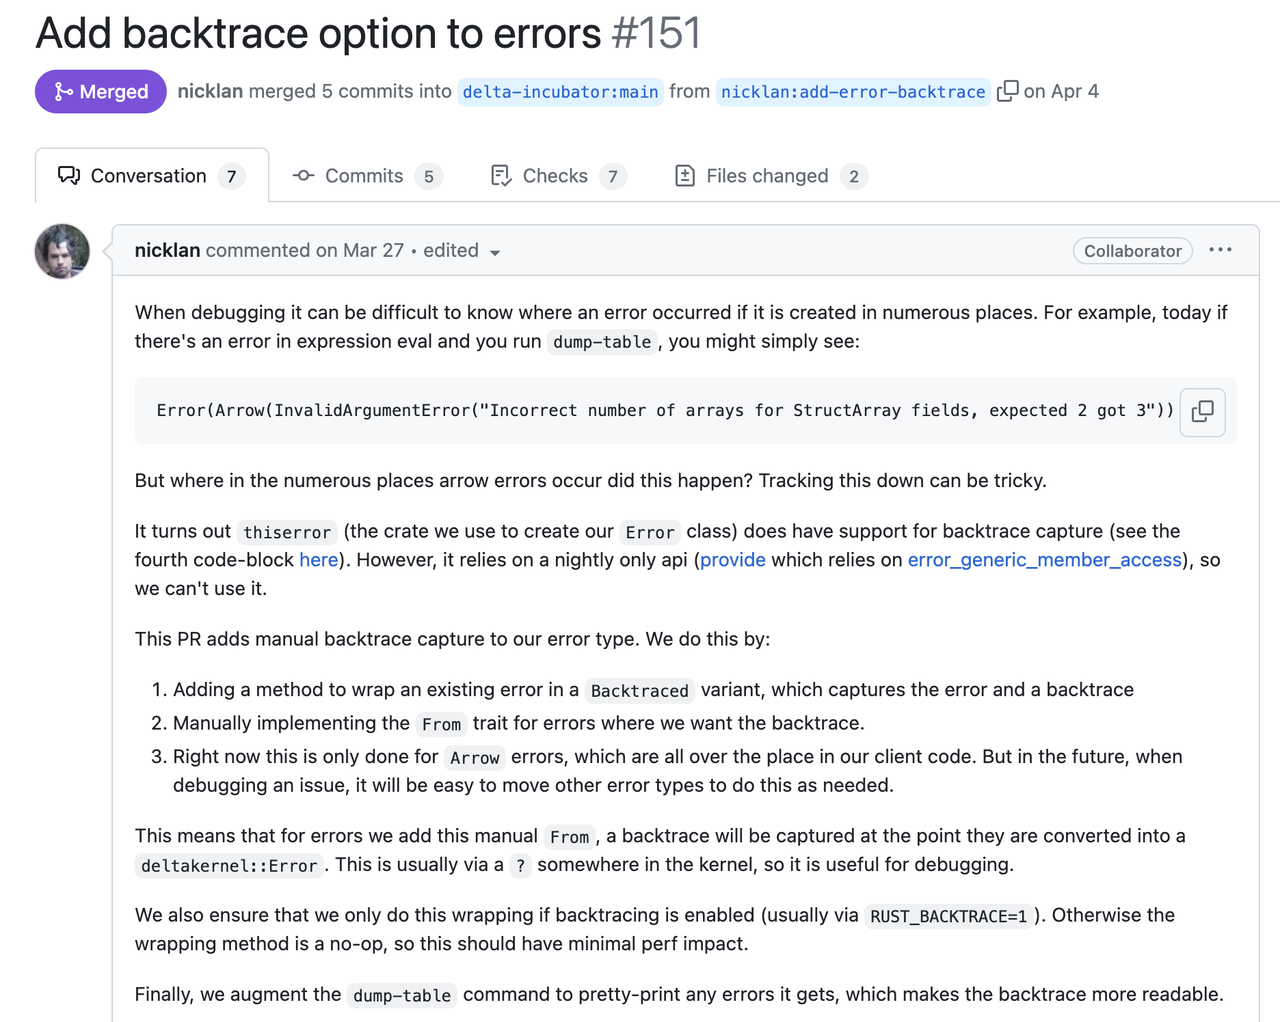 In the following sections, we will focus on the context stack and the way to present errors. And shows the way we implement it. So hopefully you can reproduce the same practices as in GreptimeDB. ### System Backtrace So, now you have the root cause (`DecodeMessage(serde_json: invalid character at 1)`). But it's not clear at which step this error occurs: when decoding the header, or the body? A intuitive thought is to capture the backtrace. `.unwrap()` is the first choice, where the backtrace will show up when error occurs (of course this is a bad practice). It will give you a complete call stack along with the line number. Such a call stack contains the full trace, including lots of unrelated system stacks, runtime stacks and std stacks. If you'd like to find the call in application code, you have to inspect the source code stack by stack, and skip all the unrelated ones. Nowadays, many libraries also provide the ability to capture backtrace on an `Error` is constructed. Regardless of whether the system backtrace can provide what we truly want, it's very costly on either CPU ([#1261](https://github.com/GreptimeTeam/greptimedb/pull/1261)) and memory ([#1273](https://github.com/GreptimeTeam/greptimedb/pull/1273)). Capturing a backtrace will significantly slow down your program, as it needs to walk through the call stack and translate the pointer. Then, to be able to translate the stack pointer we will need to include a large `debuginfo` in our binary. In GreptimeDB, this means increasing the binary size by >700MB (4x compared to 170MB without debuginfo). And there will be many noises in the captured system backtrace because the system can't distinguish whether the code comes from the standard library, a third-party async runtime or the application code. There is another difference between the system backtrace and the proposed Stacked Error. System backtrace tells us how to get to the position where the error occurs and you cannot control it, while the Stacked Error shows how the error is propagated. Take the following code snippet as an example to examine the difference between system backtrace and virtual stack: ```rust async fn handle_request(req: Request) -> Result { let msg = decode_msg(&req.msg).context(DecodeMessage)?; // propagate error with new stack and context verify_msg(&msg)?; // pass error to the caller directly process_msg(msg).await? // pass error to the caller directly } async fn decode_msg(msg: &RawMessage) -> Result { serde_json::from_slice(&msg).context(SerdeJson) // propagate error with new stack and context }


Project mention: Show HN: Spice.ai – materialize, accelerate, and query SQL data from any source | news.ycombinator.com | 2024-03-28Yes, it's on the backlog and we'll prioritize as we see demand as with https://github.com/spiceai/spiceai/issues/999.


Since joining ReductStore's project, I've been exploring alternative solutions to get a better understanding about how the project fits into current echosystem.
Rust time-series related posts
Index
What are some of the best open-source time-series projects in Rust? This list will help you:
| Project | Stars | |
|---|---|---|
| 1 | InfluxDB | 27,876 |
| 2 | greptimedb | 3,835 |
| 3 | cnosdb | 1,594 |
| 4 | spiceai | 1,501 |
| 5 | void | 1,055 |
| 6 | pq | 356 |
| 7 | ReductStore | 144 |
| 8 | qrono | 8 |
Sponsored